Case Study. Stratification in the selection of improvement projects
In problem solving, choosing projects by identifying the best opportunities in team actions often makes the difference between success and failure.
Choosing too large an area can lead to loss of focus, unnecessary spending of resources and failure to meet proposed targets.
To understand the mechanism for selecting improvement projects, let's take as a case study a company that produces cold-rolled stainless steel strips.
From the data collected from the quality information system (ERP) it is found the increase in the number of defects at the final control during the last 9 weeks - a total of 157 defects.
The reasons are:
It is required to analyze and propose a single improvement project to halve the defects.
The data are presented in the following table:

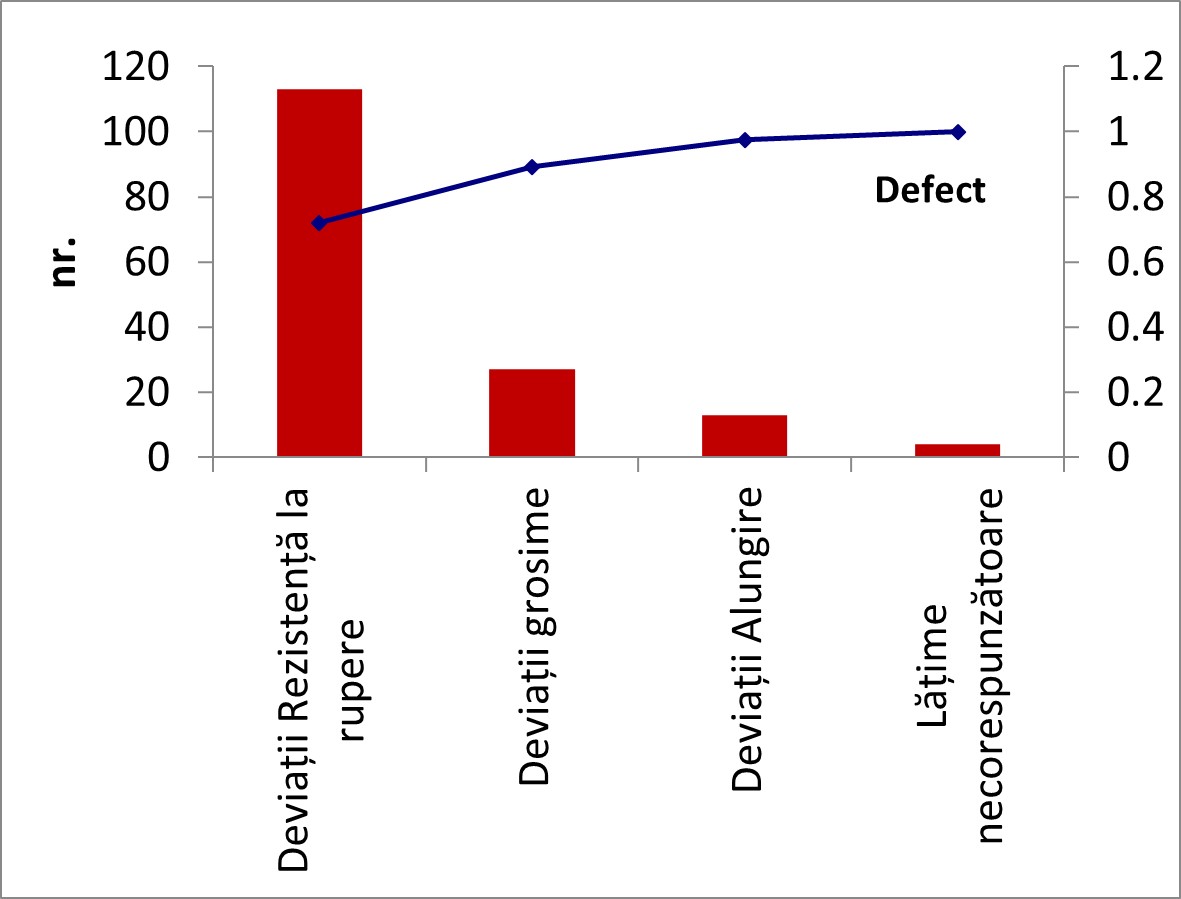
For stratification you can use the Pareto diagram (using for example Sigma XL):
It is found that the deviations to the breaking strength are majority and their decrease from 113 to 34 would reduce all defects by half.

To analyze the evolution in time, also with Sigma XL / Graphical Tools / Run Chart you can build the time diagram.

Using line charts with Excel you can stratify the trend by categories.

Successful approach to the project Improving the breaking strength by reducing the defects from 113 to 34, would reduce all the defects by half.
Choosing too large an area can lead to loss of focus, unnecessary spending of resources and failure to meet proposed targets.
To understand the mechanism for selecting improvement projects, let's take as a case study a company that produces cold-rolled stainless steel strips.
From the data collected from the quality information system (ERP) it is found the increase in the number of defects at the final control during the last 9 weeks - a total of 157 defects.
The reasons are:
- Deviation Elongation: from 1 defect / week to 2 defects / week;
- Deviations Breaking strength: from 1 defect / week to 22 defects / week;
- Inadequate width: from 0 defects / week to 1 defect / week;
- Thickness deviations: from 2 defects / week to 4 defects / week.
It is required to analyze and propose a single improvement project to halve the defects.
The data are presented in the following table:

For stratification you can use the Pareto diagram (using for example Sigma XL):
It is found that the deviations to the breaking strength are majority and their decrease from 113 to 34 would reduce all defects by half.

To analyze the evolution in time, also with Sigma XL / Graphical Tools / Run Chart you can build the time diagram.

Using line charts with Excel you can stratify the trend by categories.

Successful approach to the project Improving the breaking strength by reducing the defects from 113 to 34, would reduce all the defects by half.


